Key takeaways
- Electricity load in Texas has generally grown much faster than water load over the past 20 years, according to Gabriel Collins’s first-cut analysis of ERCOT load zones.
- Based on water use in the biggest Texas cities, the jury is still out on whether Texas water load will follow electricity’s faster growth path.
- Collins compares water and electricity load using Texas Water Development Board and ERCOT data, which he believes is probably the first assessment of its kind.
- Texas must invest more in both its water and power grids regardless, and higher municipal water use would greatly amplify that challenge.
Full Citation: Gabriel Collins, “Water Load vs. Electricity Load in Texas,” Collins Research Portal, 2 December 2024. https://collinsresearchportal.com/wp-content/uploads/2025/08/Collins_CES_Water-Load-Analysis_December-2024.pdf
Summary
Gabriel Collins compares Texas water use with electricity demand by mapping Texas Water Development Board county data onto ERCOT’s weather zones. Water use fell in most zones between 2000 and 2021 even as peak electricity load climbed between 2002 and 2024: in the Far West zone, water use rose 33% while peak load rose 310%, and in the Coast zone water use fell 9% while peak load rose 60%. Statewide water use was about 14.4 million acre-feet in 2021, and it is falling in the Panhandle and South Plains as farmers respond to depletion of the Ogallala Aquifer. Yet the four largest Texas cities supplied noticeably more water in fiscal 2022 and 2023, when peak power load also jumped. Collins’s working hypothesis is that water and power use are structurally diverging as Texas becomes less agrarian, which he plans to retest as newer statewide data arrive.
| Zone | 2021 water use (acre-feet) | Change in water use, 2000–2021 | Change in peak electricity load, 2002–2024 | Population change, 2000–2021 |
|---|---|---|---|---|
| East | 485,162 | 35% | 33% | 217,743 (24%) |
| West | 494,693 | -30% | 40% | 43,500 (8%) |
| North | 661,076 | -15% | 19% | 95,269 (14%) |
| Far West | 732,608 | 33% | 310% | 105,267 (25%) |
| South-Central | 1,209,808 | 13% | 64% | 2,076,880 (63%) |
| South | 1,592,006 | 28% | 69% | 536,812 (29%) |
| North-Central | 1,664,828 | 6% | 33% | 2,742,546 (48%) |
| Coast | 2,050,722 | -9% | 60% | 2,543,031 (51%) |
| El Paso | 391,593 | -38% | N/A | 188,268 (28%) |
| Panhandle | 2,736,201 | -25% | N/A | 34,755 (9%) |
| South Plains | 1,502,835 | -36% | N/A | -4,637 (-2%) |
| Non-ERCOT East Texas | 862,126 | -20% | N/A | 96,688 (8%) |
| Total | 14,383,658 | 8,676,122 |
Full text of the slides (from the PDF)
Slide 1. Water Load vs. Electricity
Load in Texas
Gabriel Collins, J.D.
Rice University’s Baker Institute For Public Policy, Center for Energy Studies
Water-Energy Nexus Thrust Lead, Rice WaTER Institute
2 December 2024
Slide 2. What Do We Mean by “Water Load?”
• ERCOT defines “load” as “The amount of energy in MWh delivered at any specified point or points on a system.”
• It reports electricity load for Texas on a zonal basis.
• These are shown in the on the righthand size of this page
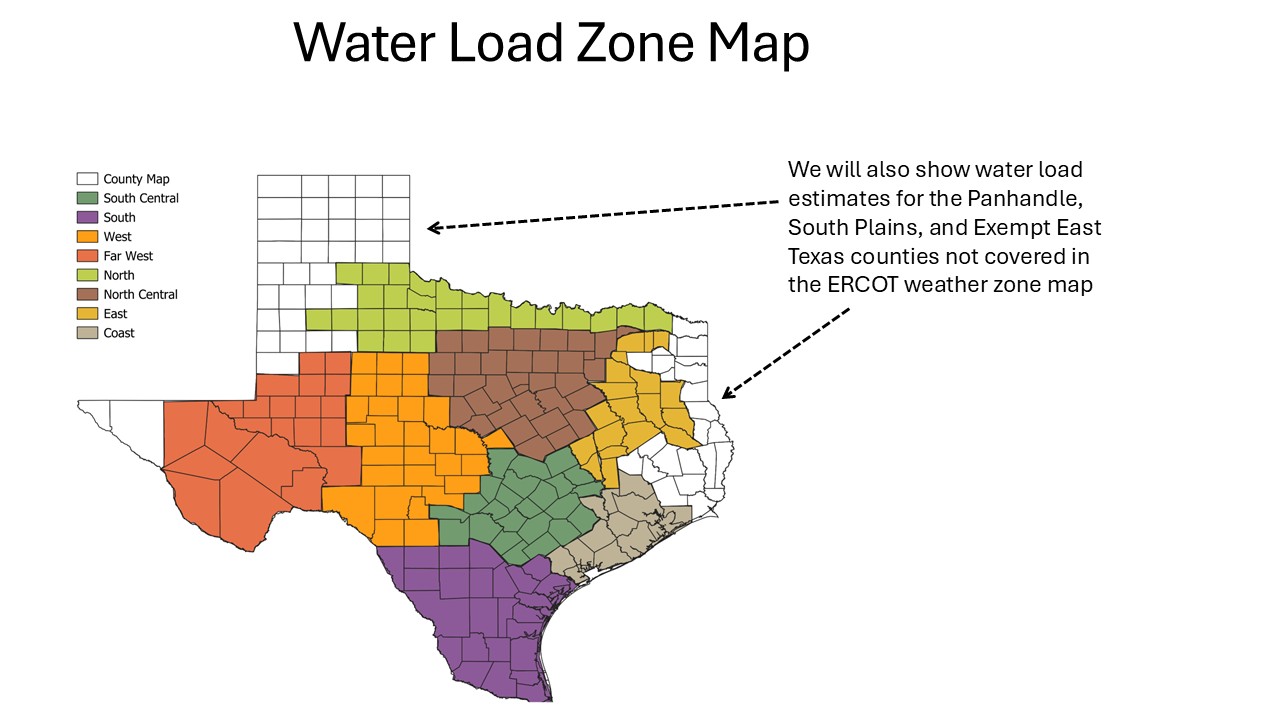
• I have used QGIS to reproduce this map and superimposed it over a map of the countries of Texas, so that we could make an accurate apples-toapples geographic comparison of water usage (reported annually by the Texas Water Development Board at the county level) and electricity load.
• The head-to-head comparison is why we speak of “water load” in this analysis
ERCOT Weather Zones
Slide 3. Our Reproduced Load Zone Map
We will also show water load estimates for the Panhandle, South Plains, and Exempt East
Texas counties not covered in the ERCOT weather zone map
Slide 4. Summary of Findings
Zone 2021 Water Use, AF
Change in Water
Use
Change in Peak
Electricity Load
Population
Change
East 485,162 35% 33% 217,743 (24%)
West 494,693 -30% 40% 43,500 (8%)
North 661,076 -15% 19% 95,269 (14%)
Far West 732,608 33% 310% 105,267 (25%)
South-Central 1,209,808 13% 64% 2,076,880 (63%)
South 1,592,006 28% 69% 536,812 (29%)
North-Central 1,664,828 6% 33% 2,742,546 (48%)
Coast 2,050,722 -9% 60% 2,543,031 (51%)
El Paso 391,593 -38% N/A 188,268 (28%)
Panhandle 2,736,201 -25% N/A 34,755 (9%)
South Plains 1,502,835 -36% N/A -4,637 (-2%)
Non-ERCOT East
Texas
862,126 -20% N/A 96,688 (8%)
Total 14,383,658 8,676,122
Panhandle
South Plains
NonERCOT
East TX
El Paso
Slide 5. Weather Zones and Corresponding Water Load Zones
Arranged Smallest-to-Largest (based on Electricity Load)
Slide 6. All Water Load Zones
Raw Volume, AF Indexed
Slide 7. East Load Zone
2000-2021 change = 35%
2002-2024 change in peak load = 33%
2000-2021 Population Change: 24%
Slide 8. West Load Zone
2000-2021 change = -30%
2002-2024 change in peak load = 40%
2000-2021 Population Change: 8%
Slide 9. North Load Zone
2000-2021 change = -15%
2002-2024 change in peak load = 19%
2000-2021 Population Change: 14%
Slide 10. Far West Load Zone
2000-2021 change = 33%
2002-2024 change in peak load = 310%
2000-2021 Population Change: 25%
Slide 11. South-Central Load Zone
2000-2021 change = 13%
2002-2024 change in peak load = 64%
2000-2021 Population Change: 63%
Slide 12. South Load Zone
2000-2021 change = 28%
2002-2024 change in peak load = 69%
2000-2021 Population Change: 29%
Slide 13. North-Central Load Zone
2000-2021 change = 6%
2002-2024 change in peak load = 33%
2000-2021 Population Change: 48%
Slide 14. Coast Load Zone
2000-2021 change = -9%
2002-2024 change in peak load = 60%
2000-2021 Population Change: 51%
Slide 15. Counties Outside the ERCOT Reported Weather Zones
• El Paso, Panhandle, South Plains, Far East
Texas.
• These are generally lower population, lower growth areas.
• El Paso is an exception.
• The Panhandle and South Plains are historically high-water use areas. Water demand in them is declining over time as farmers respond to serious depletion of the Ogallala Aquifer.
• Note that I do not presently have detailed electricity load data for these areas. I will work to obtain this. I have located a highfrequency source for the El Paso area.
Annual Water Use, AF
Source: TWDB, Author’s Analysis
Slide 16. Water Use: Looking Beyond 2021
Large Triangle Cities’ Estimated Annual Water Use, 2002-2023
Source: Comprehensive Annual Financial Reports, Author’s Analysis
• In the four largest Triangle cities (which are the 4 largest in Texas and are home to more than 7 million people), water volumes supplied rose meaningfully in Fiscal 2022 and 2023.
• This is interesting because the 2022 and 2023 calendar years also saw substantial increases in peak electricity load throughout
ERCOT.
• As 2022 and 2023 statewide water data become available, we will need to run a broader analysis.
• 2022 and 2023 potentially represent a step change in per capita water intensity for the biggest Texas metros, reaching levels not seen for a decade.
Slide 17. Conclusions
• Water and electricity are two of the four pillars of the Texas growth model (the others being governance and human capital), and thus merit close observation by policymakers.
• Most of the Load Zones in Texas saw water use decrease between 2000 and 2021, the last year for which TWDB data are available.
• It is possible that water use and power use are structurally diverging as Texas grows and becomes less agrarian.
• This hypothesis would be supported by the fact that irrigated farming requires tremendous amounts of water and because electricity is perhaps the ultimate climate volatility adaptation commodity in a state where A/C matter sin the summer and more than 60% of homes utilize electric heating in the winter.
• I’ll further test the hypothesis over time.
• As 2022 and 2023 statewide water data become available, I will repeat the zonal analysis to see if water use also grew alongside electricity usage or if it has structurally diverged.
Ever wondered how “water load growth” compares to electricity load growth in Texas?
I’ve now done a first cut analysis using data from the Texas Water Development Board and ERCOT looking at this question across the ERCOT load zones. Perhaps someone else out there has done an assessment like this but have not seen one yet and think this one is probably first of its kind.
Bottom Line: Generally electricity load has grown much faster over the past 20 years but based on analysis of water use in the biggest Texas cities, the jury is still out on whether water will follow suit (Slide 16).
Texas must invest more in its water and power grids regardless but higher water use as our municipal engines continue growing would greatly amplify the challenge.
Frequently asked questions
How does water load growth compare to electricity load growth in Texas?
Electricity load in Texas has generally grown much faster than water load over the past 20 years, according to Gabriel Collins’s first-cut analysis across ERCOT load zones. Based on water use in the biggest Texas cities, however, the jury is still out on whether water demand will follow electricity’s faster growth path.
What data was used to compare Texas water and electricity demand?
The analysis draws on data from the Texas Water Development Board and ERCOT and compares water and electricity load across the ERCOT load zones. Collins describes the work as a first-cut analysis and says he has not seen a comparable assessment, so he believes it is probably the first of its kind.
Will Texas water demand grow as fast as electricity demand?
That is not yet clear. Collins’s review of water use in the biggest Texas cities finds the jury is still out on whether water load will follow electricity load, which has generally grown much faster over the past 20 years. The key comparison appears on Slide 16 of the accompanying presentation.
Why does water load growth matter for Texas infrastructure investment?
Rising water use would greatly amplify the infrastructure challenge Texas already faces. Collins argues the state must invest more in both its water and power grids regardless of the trend, but higher water use as Texas’s municipal engines keep growing would make that investment task much larger.


Leave a Reply